Tag Archives: Sql 2016

Live Query Statistics in Sql Server 2016

Live Query Statistics is one of the new feature introduced in Sql Server 2016, it basically provides the real-time live execution plan of an active running query to the Developer/DBA.

This SSMS feature is very helpful in checking the query execution progress for a long running queries, currently we don’t know for a long running queries where it is stuck or which specific operator is taking long time or how much percentage is completed or approximately how much extra duration required to complete it etc. This feature provides a way to know all these at any given point during the query execution.
It also helps in debugging the queries without needing to wait for the completion of the query execution. As soon as the query execution starts we can see the real-time live execution plan with moving dotted lines between the operators, operator execution progress, overall query execution progress etc.

Like Actual Execution Plan option, this option can be enabled before the query execution starts, it can’t be enabled when the query execution is in progress.

Like Actual execution plan, it will have some additional performance overhead on the overall query execution. So, enable only when it is required to troubleshoot or debug the query issues. Because of this avoid enabling the live query statistics on all the session, even though we have an option to enable it for all the sessions using an extended event query_post_execution_showplan.

[ALSO READ] Compare Execution Plans in Sql Server 2016

Live query statistics feature in Sql Server 2016 provides various real-time query execution statistics like the below ones

  • Overall Query Execution Progress:

    It provides the overall query execution progress
    We can see the moving dotted-lines between the operators where execution is not yet completed. And the dotted-lines turns to solid lines once the operator/complete query execution completes. It is somewhat similar to the one we see in the SSIS data flow.

  • At operator level it provides the real-time insights like the below ones:
    • Operator execution progress
    • Operator execution elapsed time
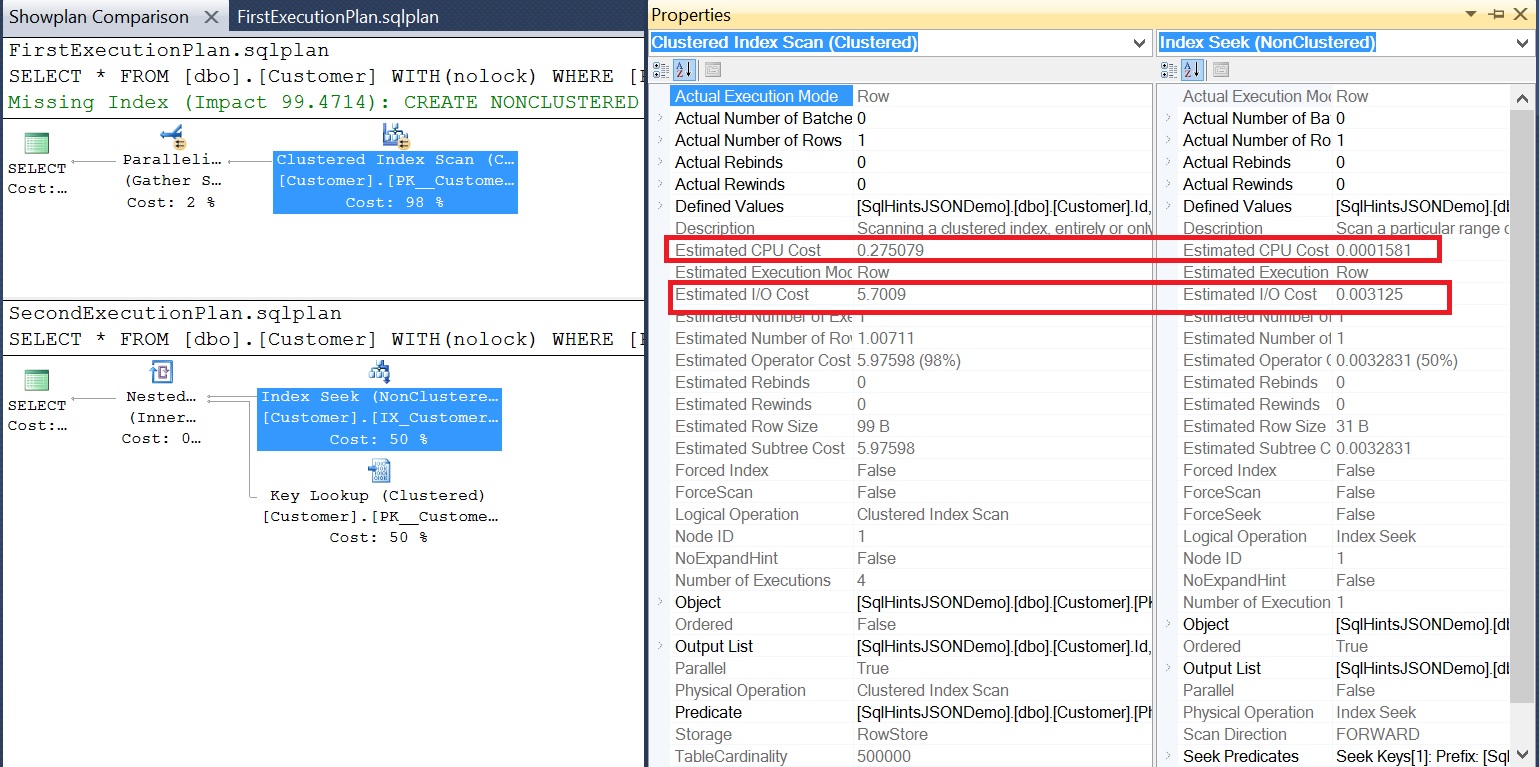
    • In the operator property window we can see real-time Actual number of rows, Operator Status, Elapsed time and various estimated values when operator execution is in progress like Estimated Number of rows, Estimated CPU Cost, Estimated I/O cost, Estimated Row Size etc. To open the operator property window, right-clicking on any operator and select the Properties option from the context menu.

Note: This article is based on the Sql Server 2016 CTP 3.1. Some of the views mentioned in this article may change in the RTM. Will try my best to keep this article updated

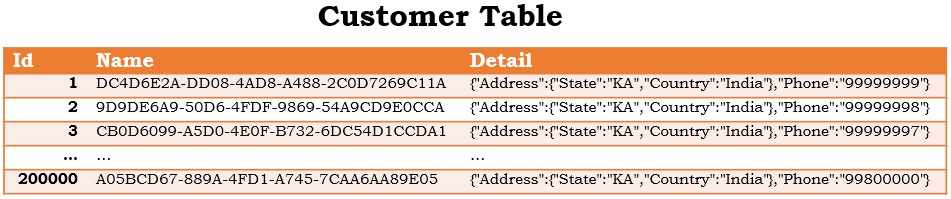
To understand this feature with examples let us create a demo Database with Customer Table as shown in the following image with 200,000 records by the following script.

--Create a demo database
CREATE DATABASE SqlHintsLQSDemo
GO
USE SqlHintsLQSDemo
GO
--Create customer table
CREATE TABLE dbo.Customer( 
    CustomerId INT IDENTITY(1,1) NOT NULL PRIMARY KEY,
    Name NVARCHAR(50),  PhoneNumber NVARCHAR(20),
    CreationDate DATETIME, ChangeDate DATETIME)
--Populate customer table with sample 200000 records
INSERT INTO dbo.Customer(Name, CreationDate, ChangeDate)
SELECT TOP 200000 NEWID(), GETDATE(), GETDATE()
FROM SYS.all_columns SC1
        CROSS JOIN SYS.all_columns SC2
GO

To get the live query execution plan, just like Actual Execution plan option we need to select the Include Live Query Statistics option as shown in the below image before executing the query

Include Live Query Statistics

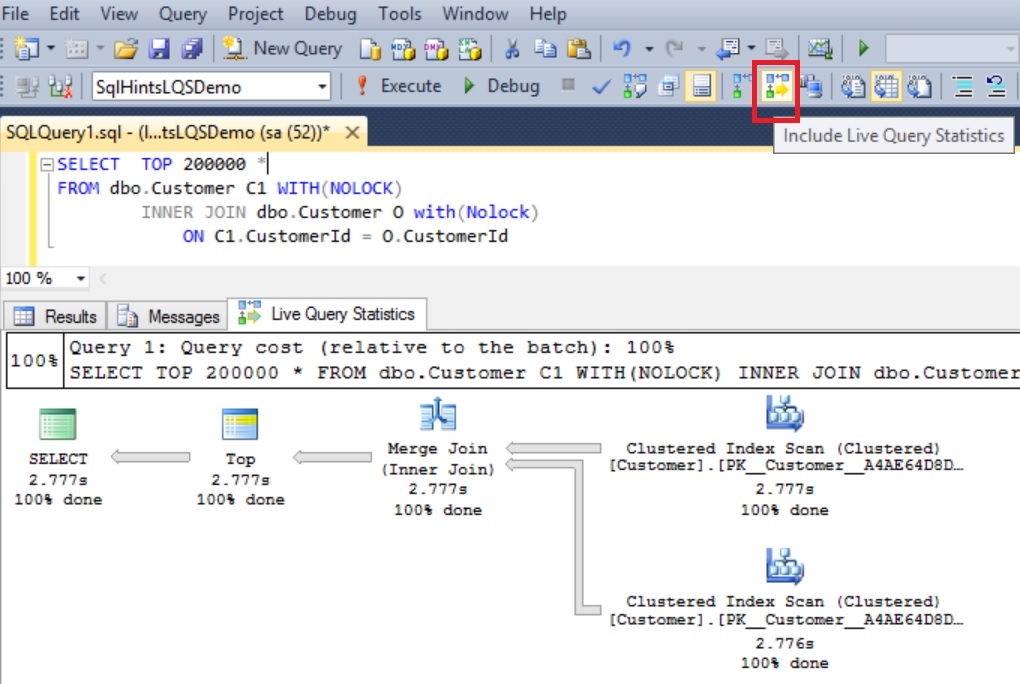
Let us execute the following query and observe it’s live execution plan in the following gif animation

SELECT  TOP 200000 *
FROM dbo.Customer C1 WITH(NOLOCK) 
		INNER JOIN dbo.Customer O with(Nolock)
			ON C1.CustomerId = O.CustomerId

RESULT:
Live Query Statistics Example 1
*Double click on the image to get the enlarged view

Let us update the Customer table statistics by the following statement. This statement is updating the Customer table stats that this table has only one record.

UPDATE STATISTICS dbo.Customer
WITH ROWCOUNT = 1

Now re-execute the previous query and observer it’s live execution plan.

SELECT  TOP 200000 *
FROM dbo.Customer C1 WITH(NOLOCK) 
		INNER JOIN dbo.Customer O with(Nolock)
			ON C1.CustomerId = O.CustomerId
OPTION(RECOMPILE)

RESULT:
Sql Live Query Statistics Example 2

We can observe from this live execution plan that, all operators from the beginning are showing 99% completed, but in the previous example this % done was gradually increased from 0 to 100. So we can assume that some of the stats displayed in the live query statistics indirectly depends on the statistics which sql server maintains for the table, indexes etc

At this moment the live query statistics is not supported for the Natively Compiled Stored Procedure.

[ALSO READ]:

Compare Execution Plans in Sql Server 2016

Comparing two execution plans is one of the new feature which is getting introduced in Sql Server 2016. This will be one of the good addition to the Sql Server features set. Many a time we come across a scenario where we need to compare the two execution plans. For example some time we want to see what is the difference in the execution plan after making some changes to it. Sometimes we come across a scenario where we observe that some stored procedure is perfectly working fine in development/System test environment but not in the production environment. In such scenario comparing the Dev/QA execution plan with production execution plan gives us the clue on what is going wrong. Without this feature currently we open the two execution plans in separate window and then we manually compare, it is tedious to figure out quickly what is going wrong.

[ALSO READ] Live Execution Plan in Sql Server 2016

Note: This article is based on the Sql Server 2016 CTP 3.0. Some of the views mentioned in this article may change in the RTM. Will try my best to keep this article updated.

Let us understand this Execution Plan comparison feature in Sql Server 2016 with examples. Let us create a Customer table with 500,000 records by the following script

CREATE DATABASE SqlHintsJSONDemo
GO
USE SqlHintsJSONDemo
GO
CREATE TABLE dbo.Customer( 
    Id INT IDENTITY(1,1) NOT NULL PRIMARY KEY,
    Name NVARCHAR(50), 	PhoneNumber NVARCHAR(20),
	CreationDate DATETIME, ChangeDate DATETIME)
GO
INSERT INTO dbo.Customer(Name, PhoneNumber, 
                         CreationDate, ChangeDate)
SELECT TOP 500000 NEWID(),
 100000000 - ROW_NUMBER() OVER (ORDER BY SC1.object_id),
 GETDATE(), GETDATE()
FROM SYS.all_columns SC1
        CROSS JOIN SYS.all_columns SC2

Enable the actual execution plan in the SSMS window and execute the below query and save the execution plan as FirstExecutionPlan.sqlplan

SELECT *
FROM dbo.Customer WITH(NOLOCK)
WHERE PhoneNumber = '99750000'

RESULT:
First Execution Plan without Index on PhoneNumber

Now let us add a index on the PhoneNumber column by the following script:

CREATE INDEX IX_Customer_PhoneNumber 
  ON dbo.Customer(PhoneNumber)

Now re-execute the previously executed query to get the Customer record based on the PhoneNumber by selecting the actual the execution plan option in the SSMS window. And save the resultant execution plan as SecondExecutionPlan.sqlplan

SELECT *
FROM dbo.Customer WITH(NOLOCK)
WHERE PhoneNumber = '99750000'

RESULT:
Second Execution Plan with Index on PhoneNumber

Now open the first execution plan (i.e. FirstExecutionPlan.sqlplan) from the Sql Server Management Studio (i.e. SSMS). Then right click anywhere in the opened execution plan window and we can see a new menu option “Compare Showplan” as shown in the below image:

Load the first execution plan to compare

Select the Compare Showplan option and load the SecondExecutionPlan.sqlplan which we have saved previously to compare with the already loaded FirstExecutionPlan.sqlplan. Then the resultant ShowPlan Comparision window will be as shown below:

Execution Plan Compare View

In the ShowPlan Comparision window select Clustered Index Scan node from the First Execution Plan and Index Seek node from the Second Execution Plan and then right click on one of these nodes and go to Properties context menu option. This will open up a side by side comparison properties window as shown in the below image where we can compare the various properties of these two nodes.

Execution Plan Comparision with Property window

In the ShowPlan Comparision window if we want to see the execution plans in side-by-side view instead of top and bottom view, then right click anywhere in the window and click on the Toggle Splitter Orientation option to make it Side-by-Side or Top-And-Bottom view.

Let us execute the below Statement by selecting the actual execution plan option in the SSMS and save the execution plan as ThirdExecutionPlan.sqlplan. The difference between this select statement and the previous select is: here the SELECT statement has the TOP clause in it:

SELECT TOP 1 *
FROM dbo.Customer WITH(NOLOCK)
WHERE PhoneNumber = '99750000'

RESULT:
Third Execution Plan with Index on PhoneNumber

Close all the open windows and then open the SecondExecutionPlan.sqlplan from SSMS. Right click anywhere in the execution plan window and from the context menu select the option “Compare Showplan” and load the ThirdExecutionPlan.sqlplan. It will bring up the following ShowPlan Comparison window as shown in the below image.


Second and Third Execution Plan comparision

From the comparison window it is clear that matching nodes are highlighted in the same color, it means no change between the two nodes of the two different plans. And TOP node is not colored, because it is not matching with any other node.

If you select one of the matching node in one plan it will automatically marks the corresponding matching node in other plan also selected. For example here I have selected the Index Seek node in the first/top plan (i.e. selection is highlighted by blue border), it automatically selects the Index Seek node in the second/bottom plan as shown in the below image.


Second and Third Execution Plan comparision Node Selection
[ALSO READ]:

Indexing Strategy for JSON Value in Sql Server 2016

This article explains the strategy for Indexing JSON value in Sql Server 2016 with examples, as we don’t have any special indexes like the XML indexes which we had for the XML value stored in the XML data type column.

[ALSO READ]:

If we are storing JSON data in a table column, then we may come across a scenario where we may need to retrieve only the records with specific JSON property value. For example if we are storing Customer address and phone details in JSON structure in a Varchar/Nvarchar column, then we may get a request to get all the customers whose phone member matches to the input value. To handle such use cases, creating an index on the JSON column is not the correct approach and of no use. As it indexes the complete JSON value like any other value in a Varchar/NVarchar column and we are looking for particular JSON Property value which is not at the beginning of the JSON string. And also it takes lot of additional storage space as the complete JSON value is indexed. So, creating such indexes is of no use.

But for JSON we do have an alternative way of Indexing JSON Property. This article explains how we can index a JSON property from the JSON string by example and also explains the storage implications if any.

Let us create a sample Database with a Customer table with 200,000 records as shown in the following image by the following script:

Customer Table
Script:

CREATE DATABASE SqlHintsJSONDemo
GO
USE SqlHintsJSONDemo
GO
CREATE TABLE dbo.Customer( 
	Id INT IDENTITY(1,1) NOT NULL PRIMARY KEY,
	Name NVARCHAR(50), Detail NVARCHAR(MAX))
GO
INSERT INTO dbo.Customer ( Name, Detail )
SELECT TOP 200000 NEWID(),
 REPLACE('{"Address":{"State":"KA","Country":"India"},
 "Phone":"@Phone"}',
 '@Phone', 100000000-ROW_NUMBER() OVER (ORDER BY SC1.object_id))
FROM SYS.all_columns SC1
		CROSS JOIN SYS.all_columns SC2

Below is the Customer table storage usage details at this point of time.

Initial SpaceUsed by the Customer table

Enable the IO and TIME statistics using the following script, to measure the performance of the queries:

--Enable Statistics
SET STATISTICS IO ON
SET STATISTICS TIME ON
GO

Let us execute the below statement to get the details of the Customer whose phone number is 99890000

SELECT *
FROM dbo.Customer
WHERE JSON_VALUE(Detail,'$.Phone') = '99890000'

RESULT:
Get Customer Detail using JSON_VALUE function

From the above result it is clear that fetching the customer data with this approach is resulting in higher number of IO and CPU time.

Let us now explore the solution for the above problem. The solution to this problem is create a non-persisted computed column where this column value will be the value of the Phone property from the JSON string and then index it. Let us understand this by performing these steps on the Customer table created above:

First add a non-persisted computed column PhoneNumber to the Customer table and the value of this computed column is the Phone property value extracted using the JSON_VALUE function from the Detail column having Address and Phone information stored in the JSON format.

ALTER TABLE dbo.Customer
ADD PhoneNumber AS JSON_VALUE(Detail,'$.Phone')

Let us verify is there any storage implication of adding a computed column

SpaceUsed by the Customer table after adding computed column

From the results it is clear that a non-persisted computed column doesn’t take any additional storage space. Non-persisted computed column value is computed/evaluated at run-time.

Let us now try to get the details of the Customer whose phone number is 99890000 by using the computed column PhoneNumber.

SELECT *
FROM dbo.Customer
WHERE PhoneNumber  = '99890000'

RESULT:
Get Customer Detail using Computed column

From the result it is clear that the computed column didn’t improve the IO and Time taken to execute the query.

Let us now create an Index on the Computed column PhoneNumber by using the following script:

CREATE INDEX IX_Customer_PhoneNumber
 ON dbo.Customer(PhoneNumber)

When you create this index you may get the below warning. The reason for the warning is Sql Server doesn’t know what will be the length of the value which will be extracted by the JSON_VALUE function. And the maximum length of the value that can be returned by JSON_VALUE function is NVARCHAR(4000).

Warning! The maximum key length for a nonclustered index is 1700 bytes.
The index ‘IX_Customer_PhoneNumber’ has maximum length of 8000 bytes.
For some combination of large values, the insert/update operation will fail.

Let us verify the Customer Table storage detail after adding index on the computed column:

SpaceUsed by the Customer table after adding index on computed column

From the result it is clear that there is no change the storage used for the table, it has taken only the extra storage for the index. So the computed column is still not persisted only in the index tree the computed value is persisted. Which is similar to creating index on any other table column.

Now let us verify whether we have any improvement in the performance of the query to retrieve the Customer details based on the Phone JSON property value (i.e. by the indexed computed column PhoneNumber).

SELECT *
FROM dbo.Customer
WHERE PhoneNumber  = '99890000'

RESULT:
Get Customer Detail using Indexed Computed column

From the result it is clear that adding index on the computed column has drastically improved the IO and CPU time.

We can execute the below statement to disable the IO and TIME statistics, which we have enabled in the beginning of this article.

--Disable statistics
SET STATISTICS IO OFF
SET STATISTICS TIME OFF
GO

Conclusion: If we have a need to retrieve record from table based on a particular property value in the JSON string column, in such scenario creating a computed column whose value is extracted by the JSON_VALUE function from the JSON string column and indexing is the optimal approach. It takes extra storage for the index just like indexing any other column. And the computed column is still not persisted even after creating an index on it. And while creating index it takes some extra time to evaluate and extract the computed value to store in the index pages, again this is noting different when create a index on a computed column.

[ALSO READ]: